Showing posts with label election. Show all posts

Sunday, November 18, 2012

A Measure of Success

538's estimate of state probabilities.
Came up with a way to measure 538's success in predicting the election other than a simple boolean for each state. All predictions are weighted by their certainty. A 50/50 estimate would thus count for nothing (it's worth pointing out that those calling the election a tossup were doing this...), whereas a prediction of 100% would yield a weight of 1.0. Correct predictions are positive, incorrect negative (538 got all 50 states right, plus DC). This weight is then multiplied by a state's electoral votes, summed, and then normalized on the range of the worst score (100% certainty on all, but getting them all wrong: -538) to the best (100% certainty, all correct: 538). Doing this gives 538 a score of .9485. Note that I treated states that award their electoral votes in a split manner as all or nothing for simplicity.

Baseline estimate of state probabilities
To provide more insight, a naive model was used to provide a baseline: all swing states estimated at 50/50 and all non swing states at 100%. This gives a score of 0.8977. This means that 538's estimate gets us 49.66% of the way from the baseline to a perfect forecast. Unfortunately, the data necessary to apply this measure to other forecasts wasn't easily available (and by "easily", I mean "with the amount of effort I was willing to put into this blog post"), but I grabbed some from a couple other sites.

PEC's last estimate map before the election.
Princeton Election Consortium's last posted data was in the form of a color map, so I extracted their estimates by examining the colors and they were clearly not that precise. Applying my measure, they got a score of 0.9429, and were 44.19% of the way from the baseline to a perfect forecast.

Simon Jackman's swing state estimate data.
Simon Jackman over at The Huffington Post had this estimate of swing states probabilities the day before the election. I couldn't find the non swing state opens, so filled in 100% for them, which almost certainly inflated his overall score. It worked out to 0.9544, and was 55.38% of the way from the baseline to perfect.

If anyone has other data (or better versions of the data I did use) I'd be happy to include it in this post. Here is the spreadsheet I used to compute the scores.

Bonus: I edited these maps that have been making the rounds since the election that scale state size according to electoral votes and population respectively to have purple shading that reflects the percentage of Obama and Romney votes. They don't really warrant a post of their own, especially since I didn't create the original maps they're based on.

Size proportional to electoral votes (1 square = 1 vote)
Size proportional to population (original image didn't include HI or AK)


Thursday, June 7, 2012

How bad can the electoral college be?


I was curious as to how poorly the electoral college could reflect the popular vote, so I whipped up a program to compute it (assuming only two parties). Below you see the map as it would need to be for the red candidate to win (yeah, yeah, I notice I'm showing the Republican candidate as winning unfairly, but that was just random). The best (or should that be worst?) answer involved all the districts of Nebraska and Maine voting together so I didn't need to split their electoral votes in the picture, although the program did explore those options. While there are some odd states voting together, for expediency I'll ignore that detail since it's not impossible demographic or political shifts could lead to such a result. In order to carry the red states with just over 50% in each, only 21.61% of the popular vote would have to be obtained (21.3% if you count the US territories which currently aren't represented in the electoral college). You can see many of the least populated states are chosen, maximizing the error. I knew the electoral college was bad, but this is astounding! To have a candidate defeated who had more than 78% of the vote would simply be unacceptable.


To force a tie you need just a slightly smaller percentage of popular vote: 21.52% (or 21.2% if counting the US territories).


Next I took the election results for each of the past three presidential races (the last three all used 2000 census data) and changed my program to look for the minimum subset of the electoral votes actually carried by the winner that still ensured victory. All three required less than 25% of the popular vote for victory (the 2004 minimum solution required 271 electoral votes, not just 270). We can also approach the inherent unfairness of the electoral college another way, by assuming each state's electoral votes per percentage of population is the same. This makes all states more equal, but the very "all or nothing" nature of the system would still allow victory with (270 / 538) * .5 = 25.09% of the popular vote, since you only need just barely over 50% of each state to win all its electoral votes. For this last calculation I ignored the proportional vote system of Maine and Nebraska for simplicity. The rough bottom line is this: a candidate for president can win 75% of the popular vote and still lose the electoral college.

2008: winner is in blue
270 electoral votes
24.0566% of popular vote actually required (includes US territories)
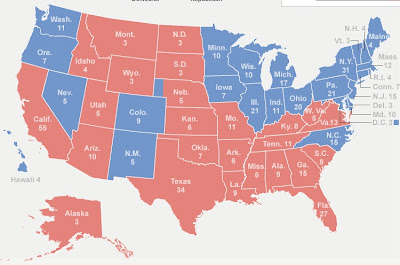

2004: winner is in red
271 electoral votes
24.33% of popular vote actually required (includes US territories)


2000: winner is in red
270 electoral votes
24.575% of popular vote actually required (includes US territories)